What Really Drives Your Insurance Premiums (And What You Control)
Premiums aren't random. Which rating factors carry the most weight, what each lever actually saves, and where to spend your effort for the best return.

Table of contents

If your premium went up and nothing about your life changed, you’re not imagining it and you’re not being singled out.
Insurance pricing is a mix of things about you and things about everyone else in your pool. Understanding which is which matters, because it tells you where effort is worth spending and where you’re better off planning around the outcome instead.
The split that matters
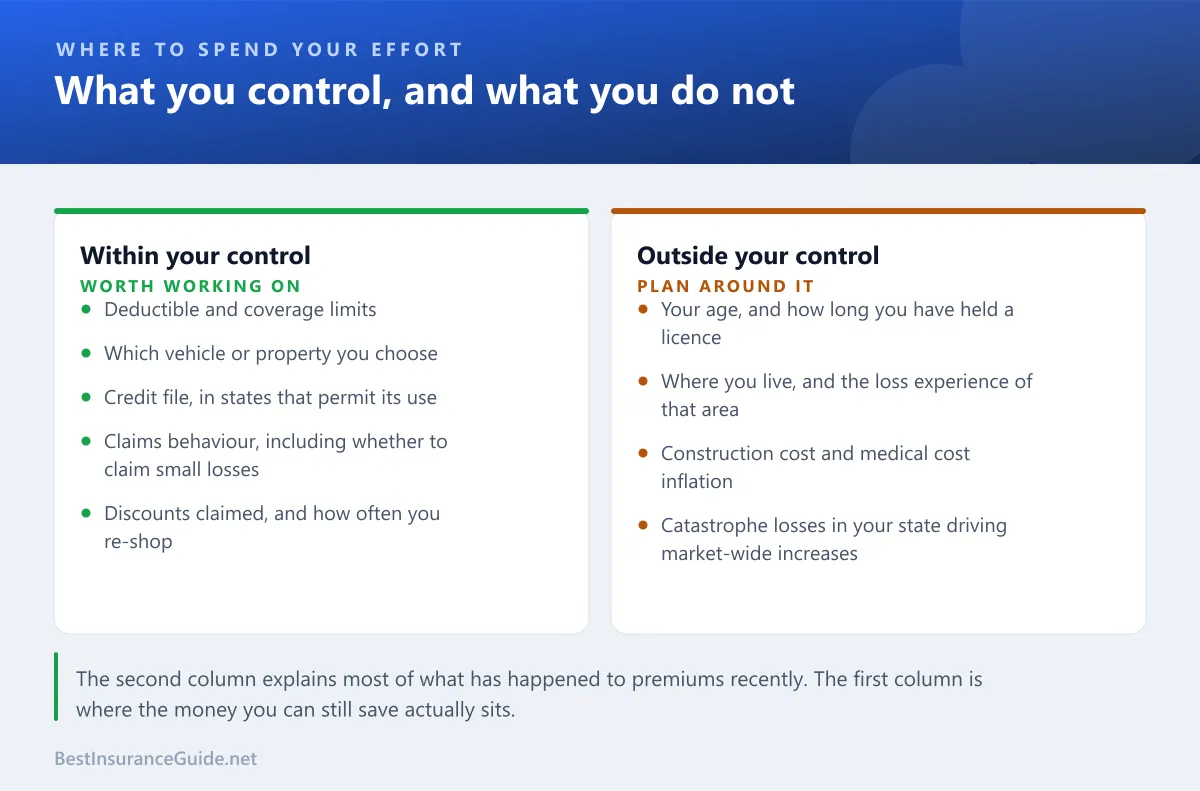
The right-hand column explains most of what’s happened to premiums over the past few years. Construction costs, medical costs, catastrophe losses and reinsurance pricing have all moved sharply, and those flow through to entire books of business regardless of individual behaviour. Our guide to insurance rate trends covers that side in detail.
The left-hand column is where money you can still save actually sits.
Which factors carry the most weight
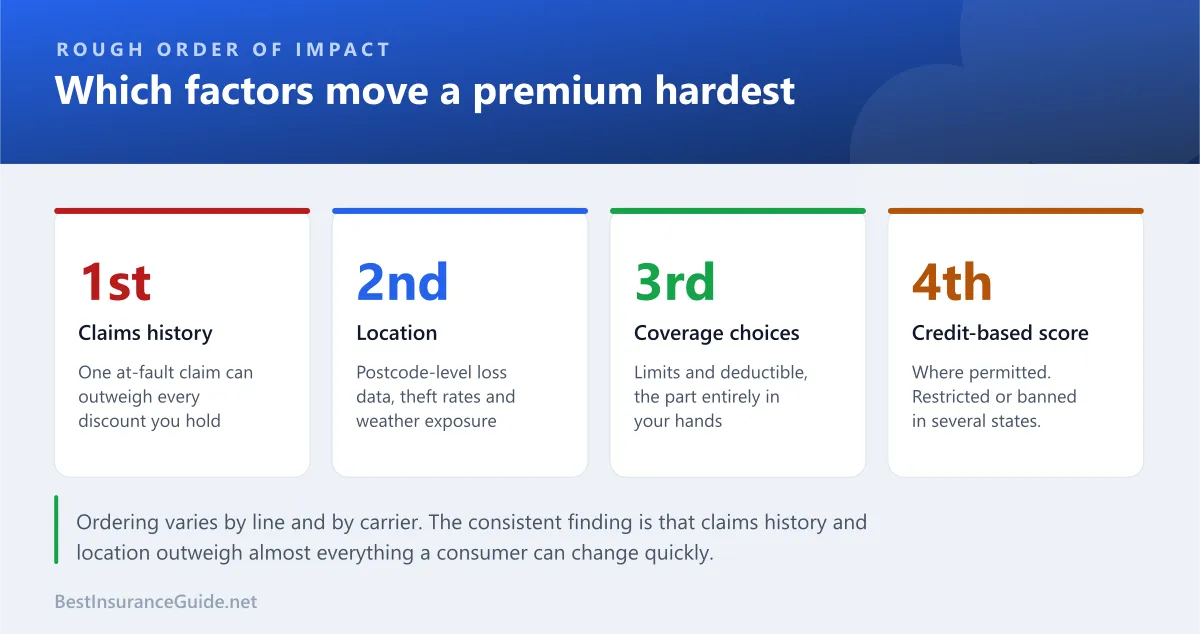
Ordering varies by line and by carrier, and any ranking is a generalisation. The consistent finding is that claims history and location outweigh almost everything a consumer can change quickly, and that coverage choices are the biggest lever genuinely in your hands.
Worked example: one claim against every discount
A driver with a $1,540 annual premium holds five discounts totalling 28%.
| Amount | |
|---|---|
| Premium before discounts | $2,140 |
| All five discounts applied | −$600 |
| Current premium | $1,540 |
Then one at-fault accident.
| Year | Premium | Note |
|---|---|---|
| Before | $1,540 | Five discounts, claims-free among them |
| Year 1 | $2,290 | Surcharge applied, claims-free discount lost |
| Year 2 | $2,105 | Surcharge tapering |
| Year 3 | $1,880 | |
| Year 4 | $1,640 | Nearly recovered |
| Four-year cost | +$2,235 |
Every discount they hold is worth $600 a year. One claim cost more than three years of all of them combined. This is the single strongest argument for the “don’t file small claims” advice, and for the higher deductible that removes the temptation.
Location, which people underestimate
Insurers rate at postcode level, using local loss data: theft rates, weather exposure, litigation patterns, repair labour costs, even the density of uninsured drivers.
Worked example: the same driver, four addresses
Identical driver, identical car, identical coverage. Only the garaging address changes.
| Location type | Annual premium | Driver of the difference |
|---|---|---|
| Rural county | $1,180 | Low theft, low traffic density, cheap labour |
| Small city suburb | $1,470 | Moderate everything |
| Large metro suburb | $1,890 | Higher theft and collision frequency |
| Dense urban centre | $2,640 | Theft, vandalism, uninsured drivers, litigation |
$1,460 a year between the top and bottom rows, with nothing about the person different.
You can’t do much about this beyond knowing it exists. It’s worth factoring into a move, though, and it’s worth re-quoting immediately after one, because your old carrier may price your new address badly while another prices it well.
The credit factor
In most states, insurers use a credit-based insurance score. It isn’t your credit score. It weights the same underlying data differently, built to predict claims frequency rather than default risk.
Several states restrict or prohibit it. California, Massachusetts and Hawaii bar it for auto, and Maryland restricts it for home. The NAIC tracks where the rules apply.
Where it’s permitted, the effect is larger than most people expect, frequently rivalling driving record. That’s uncomfortable, and it’s also actionable: the things that improve a credit file (paying on time, lowering utilisation, keeping old accounts open, avoiding new applications before shopping) compound across every policy you hold, year after year.
It’s slow. It’s also one of the few levers that keeps paying.
What actually works, ranked

Worked example: working the list top down
A household with $1,540 auto and $2,180 home, $3,720 combined.
| Step | Action | Saving |
|---|---|---|
| 1 | Re-shopped both at renewal, matched coverage exactly | −$420 |
| 2 | Raised auto deductible $500 → $1,000, home $1,000 → $2,500 | −$395 |
| 3 | Bundled at the winning carrier, verified against staying split | −$310 |
| 4 | Corrected annual mileage from 15,000 to 6,200 | −$185 |
| 5 | Claimed three discounts nobody had mentioned | −$240 |
| New combined premium | $2,170 |
$1,550 a year saved, coverage unchanged, roughly two hours of work.
Note the ordering. Re-shopping was the single largest item, and it’s the one people skip because it feels like the most effort. It usually isn’t.
Line-by-line: what moves what
Auto. Driving record, location, vehicle, annual mileage, age and experience, credit where permitted, coverage choices. Vehicle choice is underrated: two cars of similar price can differ by 60% or more on insurance because of repair costs, theft rates and claims history.
Home. Rebuild cost, roof age and material, location and catastrophe exposure, claims history on the property itself (not just yours, the property’s), protective devices, and the age of wiring, plumbing and HVAC. Roof age has become one of the strongest single factors in recent years.
Health. Age, location, tobacco use and plan tier. Notably, health status and gender cannot be used in ACA-compliant plans, which makes this the most constrained rating environment in insurance.
Life. Age, health, tobacco, family history, occupation and hobbies. Health here is genuinely decisive in a way it isn’t elsewhere, which is why locking in cover while young and healthy matters so much. Our life insurance basics guide covers it.
Pet. Species, breed, age and location. Age is relentless: premiums rise every year as the animal gets older, which is the thing people don’t model when they buy at twelve weeks old.
Why your renewal went up when nothing changed
Worth stating plainly, because it’s the most common question we get.
Premiums are set against the pool, not just against you. When construction costs rise, every home premium rises. When medical costs rise, every liability premium rises. When a state takes catastrophe losses, carriers reprice or withdraw, and reduced competition raises prices for everyone remaining.
Your clean record protects you from being priced worse than your neighbours. It doesn’t insulate you from the market moving.
Which is the argument for re-shopping rather than for despair. Carriers absorb these pressures at different speeds and reprice at different times, so the gap between the cheapest and most expensive quote for the same person often widens in a hard market rather than narrowing.
The honest summary
You control your deductible, your limits, what you drive, whether you claim small losses, how often you shop, and slowly your credit file. That’s a genuinely useful list and working it properly is worth four figures a year for most households.
You don’t control your age, your postcode, medical inflation or the weather. Trying to is where people waste effort.
Start with the re-shop. Set a reminder for a month before your next renewal, get three quotes at matched coverage using our comparison guide, and work down from there.