Insurance Rate Trends 2026: Why Premiums Are Rising
Premiums rose across auto, home and health. What's driving it, how to tell a market increase from a problem with your own file, and what actually works.

Table of contents

If your renewal arrived higher than last year despite a clean record, nothing has gone wrong with your file. You’re seeing the market.
Premiums have risen across most lines and most states over recent years, and the causes have very little to do with individual behaviour. That’s frustrating, and it’s also useful to understand, because it changes which responses actually work.
What’s pushing rates up
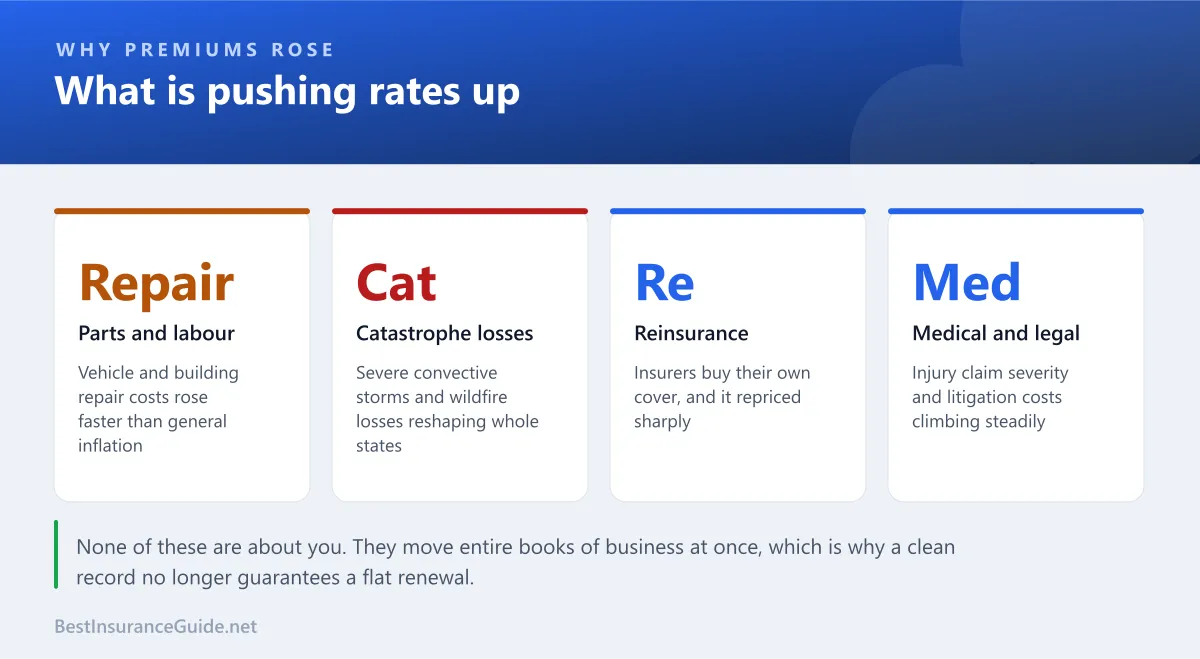
Repair costs have outpaced general inflation for several years. Vehicles carry more sensors, cameras and calibration requirements, so a bumper replacement that once meant a panel and paint now means recalibrating driver assistance systems. On the property side, materials and skilled labour have both risen sharply.
Catastrophe losses have reshaped whole state markets. Severe convective storms, hail in particular, have become a larger share of insured losses than the headline hurricane events, partly because they’re frequent and widespread rather than concentrated.
Reinsurance is the one consumers never see. Insurers buy their own cover against large aggregate losses, and reinsurance repriced sharply. That cost flows straight into primary premiums.
Medical and litigation costs drive the injury side of liability claims, and claim severity has climbed steadily even where frequency hasn’t.
Worked example: why a bumper costs what it does
A minor front-end collision on a 2019 sedan versus a 2025 equivalent.
| Item | 2019 model | 2025 model |
|---|---|---|
| Bumper cover and fittings | $640 | $890 |
| Paint and materials | $410 | $520 |
| Labour | $520 | $700 |
| Parking sensors | $180 | $340 |
| Forward radar recalibration | — | $620 |
| Camera recalibration and alignment | — | $480 |
| Total | $1,750 | $3,550 |
The same accident costs roughly twice as much to repair. Nothing about the driver changed. Multiply that across a whole book of business and the rate filing follows.
Is it the market, or is it you?
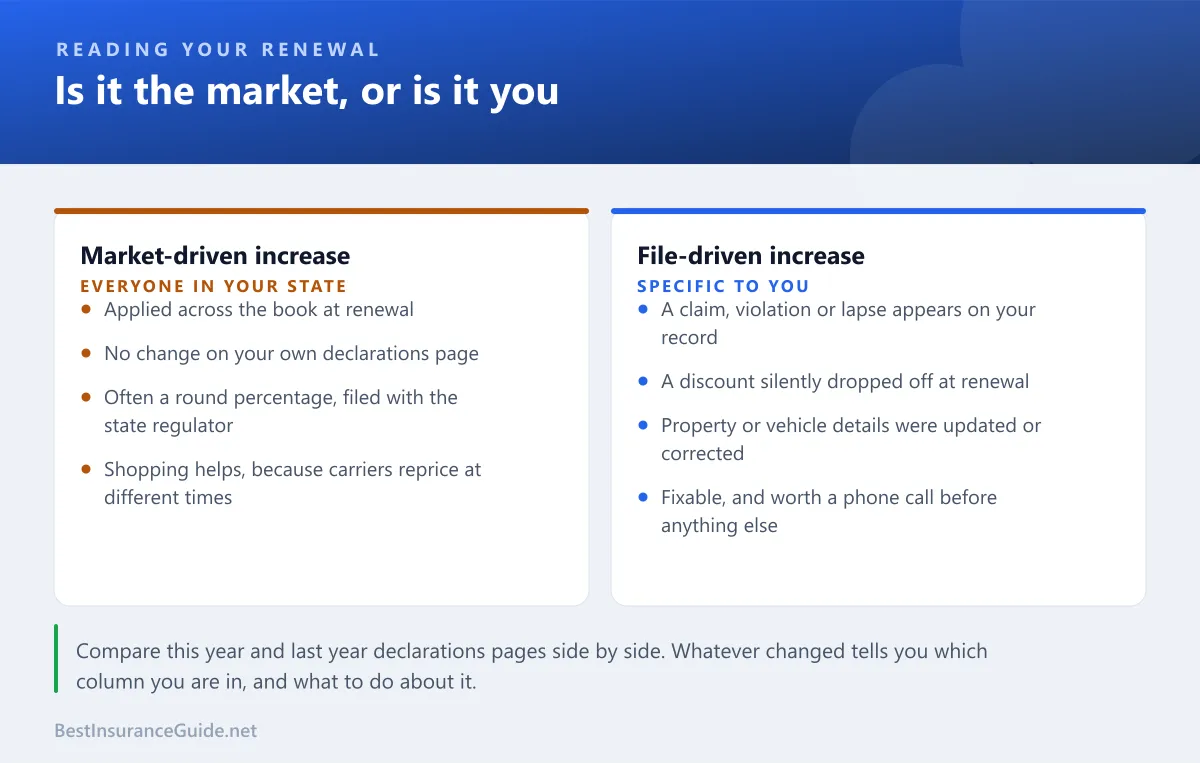
This is the first thing to establish, because the two require completely different responses.
The test takes five minutes: put this year’s declarations page next to last year’s and look for anything that changed.
Worked example: two renewals, same increase
Two households both see a $410 increase on auto.
Household A
| Last year | This year | |
|---|---|---|
| Coverage limits | 100/300/100 | 100/300/100 |
| Deductible | $1,000 | $1,000 |
| Discounts listed | 6 | 6 |
| Vehicles and drivers | Unchanged | Unchanged |
| Premium | $1,640 | $2,050 |
Nothing changed. This is a filed rate increase applying across the book, and the response is to shop, because carriers absorb these pressures at different speeds.
Household B
| Last year | This year | |
|---|---|---|
| Coverage limits | 100/300/100 | 100/300/100 |
| Deductible | $1,000 | $1,000 |
| Discounts listed | 6 | 4 |
| Vehicles and drivers | Unchanged | Unchanged |
| Premium | $1,640 | $2,050 |
Two discounts dropped off. Possibly a lapsed paperless setting, possibly a good student transcript not submitted. One phone call, not a shopping exercise.
Same increase, entirely different fix. Most people shop when they should call, or accept when they should shop.
What actually works
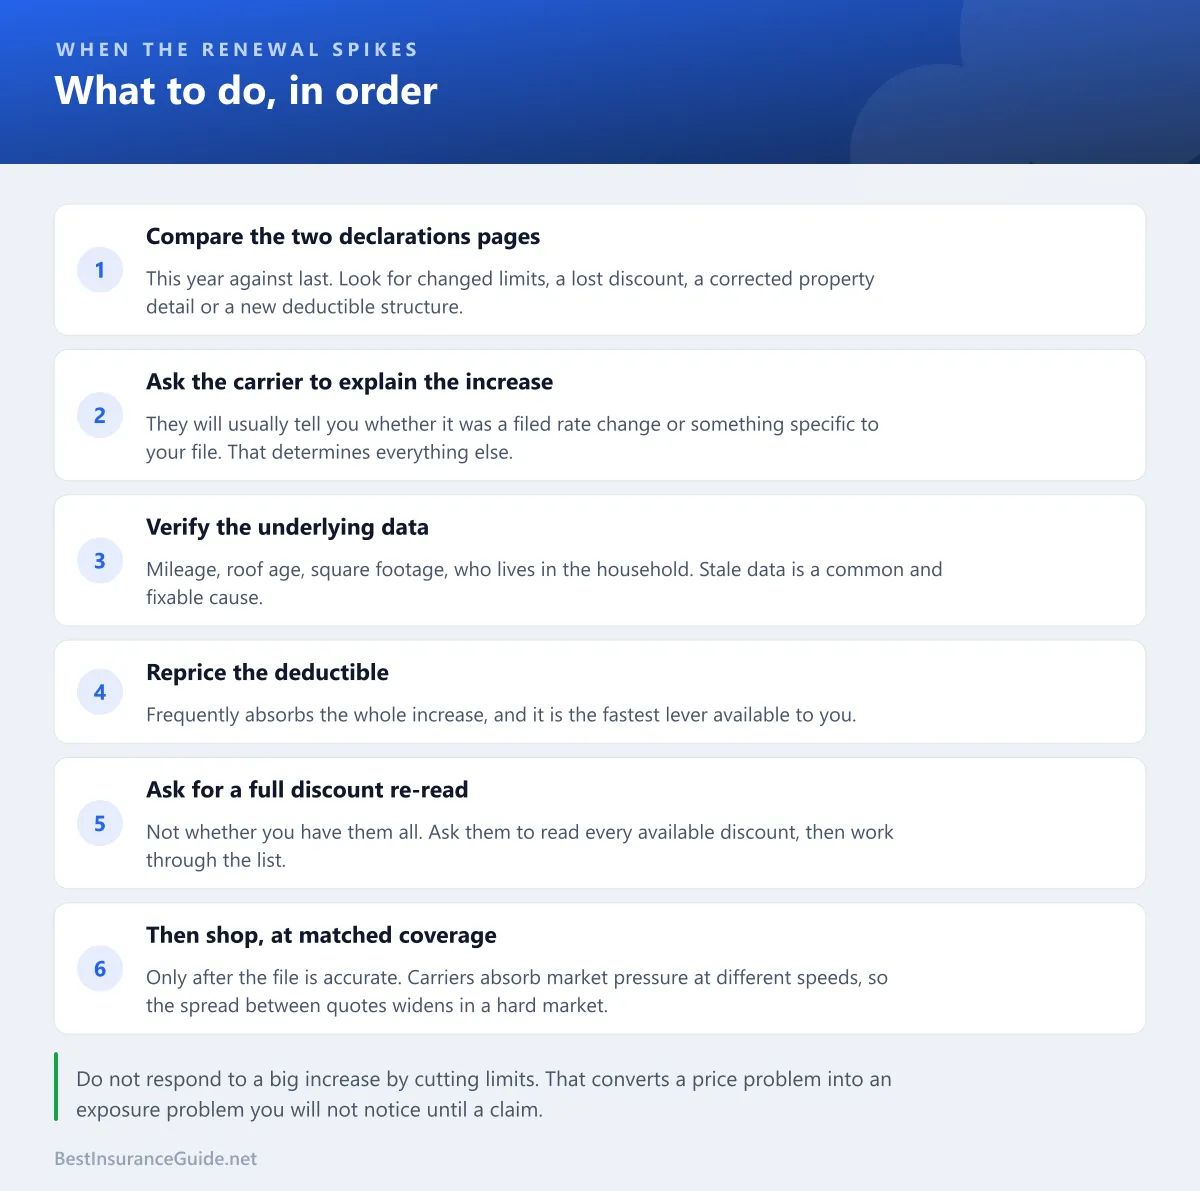
The ordering matters. Shopping is last, not first, because carrying an inaccurate file to a new carrier just reproduces the problem somewhere else.
Worked example: working the list against a hard-market increase
A household facing a combined auto and home increase from $4,180 to $5,240.
| Step | Action | Result |
|---|---|---|
| 1 | Compared declarations pages | Roof age had been updated to “unknown” after a data refresh |
| 2 | Supplied roof invoice from 2021 | −$460 |
| 3 | Corrected annual mileage, 14,000 to 7,500 | −$210 |
| 4 | Raised home deductible $1,000 to $2,500 | −$390 |
| 5 | Discount re-read surfaced two missing | −$180 |
| 6 | Shopped at matched coverage, switched auto only | −$340 |
| New combined premium | $3,660 |
They ended below where they started, on the same coverage, in a rising market. Most of that came from steps 2 and 3, which were corrections rather than negotiations.
That won’t always be available. But the diagnostic step is always worth doing first, because a stale data point is the single most common cause of an increase that looks inexplicable.
What doesn’t work
Cutting limits. This is the reflex response and it’s the wrong one. It converts a price problem into an exposure problem you won’t notice until a claim, and as our guide on minimum limits works through, the shortfall becomes a personal debt.
Dropping endorsements you’d struggle to replace. Water backup, extended replacement cost, scheduled valuables. Small line items, large claim consequences.
Filing more claims to “get value”. A claim slightly above your deductible typically costs more in surcharges over three to five years than it pays out. Our insurance basics guide has the arithmetic.
Doing nothing. The most expensive option, and the most common. Insurers have no obligation to tell you when you’ve stopped being competitively priced, and they don’t.
The state picture
Increases haven’t been evenly distributed, and where you live now matters more than it did a decade ago.
States with concentrated catastrophe exposure, wildfire, hurricane, or severe convective storm activity, have seen the sharpest movements. In several, carriers have reduced new business, tightened underwriting on older roofs, or withdrawn from segments entirely. Reduced competition then pushes prices up independently of loss costs, which is a second-order effect people underestimate.
If you’re in one of those markets, two practical implications. Independent agents become more valuable, because they can see which carriers are still writing. And maintaining an insurable property, roof condition especially, matters more than it used to, because eligibility rather than price is increasingly the binding constraint.
Your state department of insurance publishes filed rate changes, and the NAIC publishes complaint and market data. Both are free and both tell you more about your local market than any national average will.
What to expect
Rate cycles do turn. Insurers raise rates until returns recover, then compete for market share again, and prices soften.
The honest caveat is that several of the pressures here look structural rather than cyclical. Vehicle repair complexity isn’t going to reverse. Building costs rarely fall. The realistic expectation is a slowing of increases rather than reductions.
Which makes the habit more important than the forecast. Set a reminder a month before every renewal, verify your own file, then shop at matched coverage using the process in our comparison guide. In a hard market the spread between the cheapest and most expensive quote for the same person tends to widen rather than narrow, because carriers reprice at different times.
That’s the one thing genuinely within your control, and it’s worth more now than it was when rates were flat.